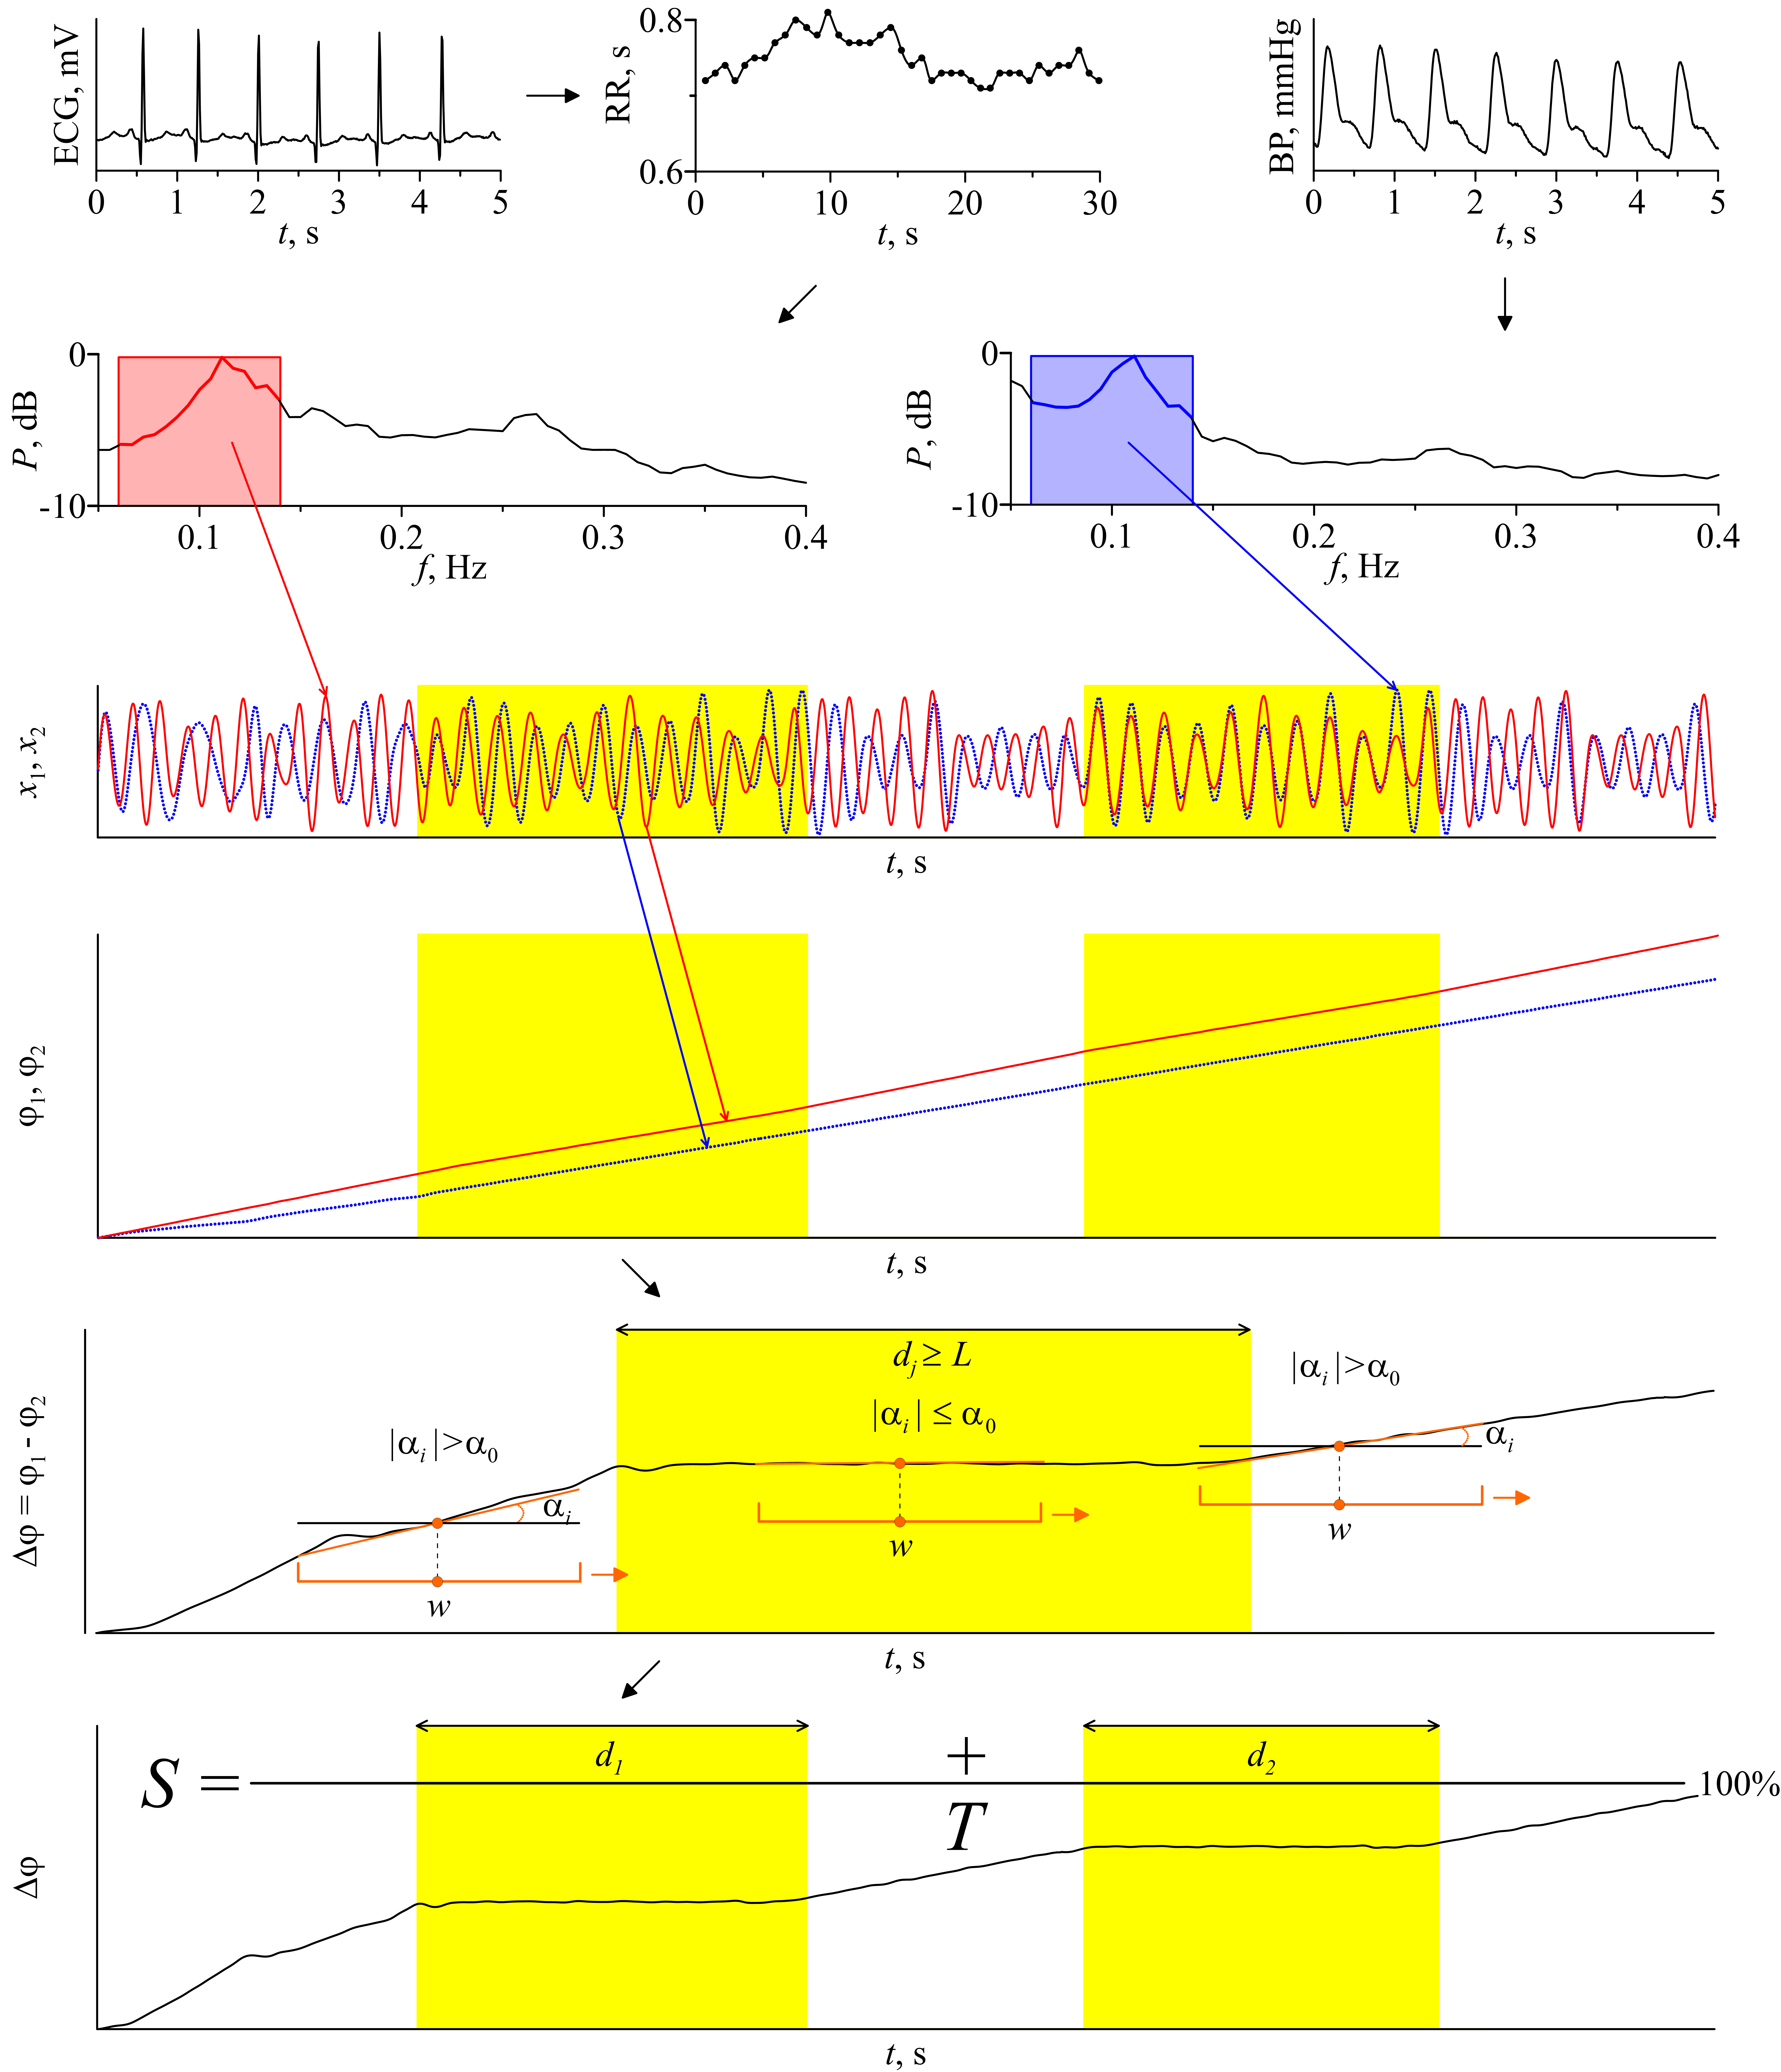
The method is based on the approach for detecting synchronization of complex systems from the analysis of their non-stationary time series [Karavaev et al., 2009; Kiselev et al., 2016b]. Figure 1 illustrates the main stages of the method. A detailed description of the method is described in the article [Karavaev et al., 2021].

Figure 1 Schematic illustration of the method for estimating the total percentage S of phase synchronization. The epochs of synchronization are shown in yellow.
Articles that may be helpful:
1. Karavaev A.S., Prokhorov M.D., Ponomarenko V.I., Kiselev A.R., Gridnev V.I., Ruban E.I., Bezruchko B.P. Synchronization of low-frequency oscillations in the human cardiovascular system // CHAOS. 2009. V. 19. P. 033112. doi: 10.1063/1.3187794.
2. Kiselev, A.R., Karavaev, A.S., Gridnev, V.I., Prokhorov, M.D., Ponomarenko, V.I., Borovkova, E.I., Shvartz, V.A., Ishbulatov, Y.M., Posnenkova, O.M., and Bezruchko, B.P. (2016b). Method of estimation of synchronization strength between low-frequency oscillations in heart rate variability and photoplethysmographic waveform variability. Russ. Open Med. J. 5:e0101. doi: 10.15275/rusomj.2016.0101.
3. Karavaev A.S., Borovkova E.I., Skazkina V.V., Hramkov A.N., Ponomarenko V.I., Runnova A.E., Gridnev V.I., Kiselev A.R., Prokhorov M.D., Penzel T. Synchronization of the processes of autonomic control of blood circulation in humans is different in the awake state and in sleep stages // Frontiers. 2021.
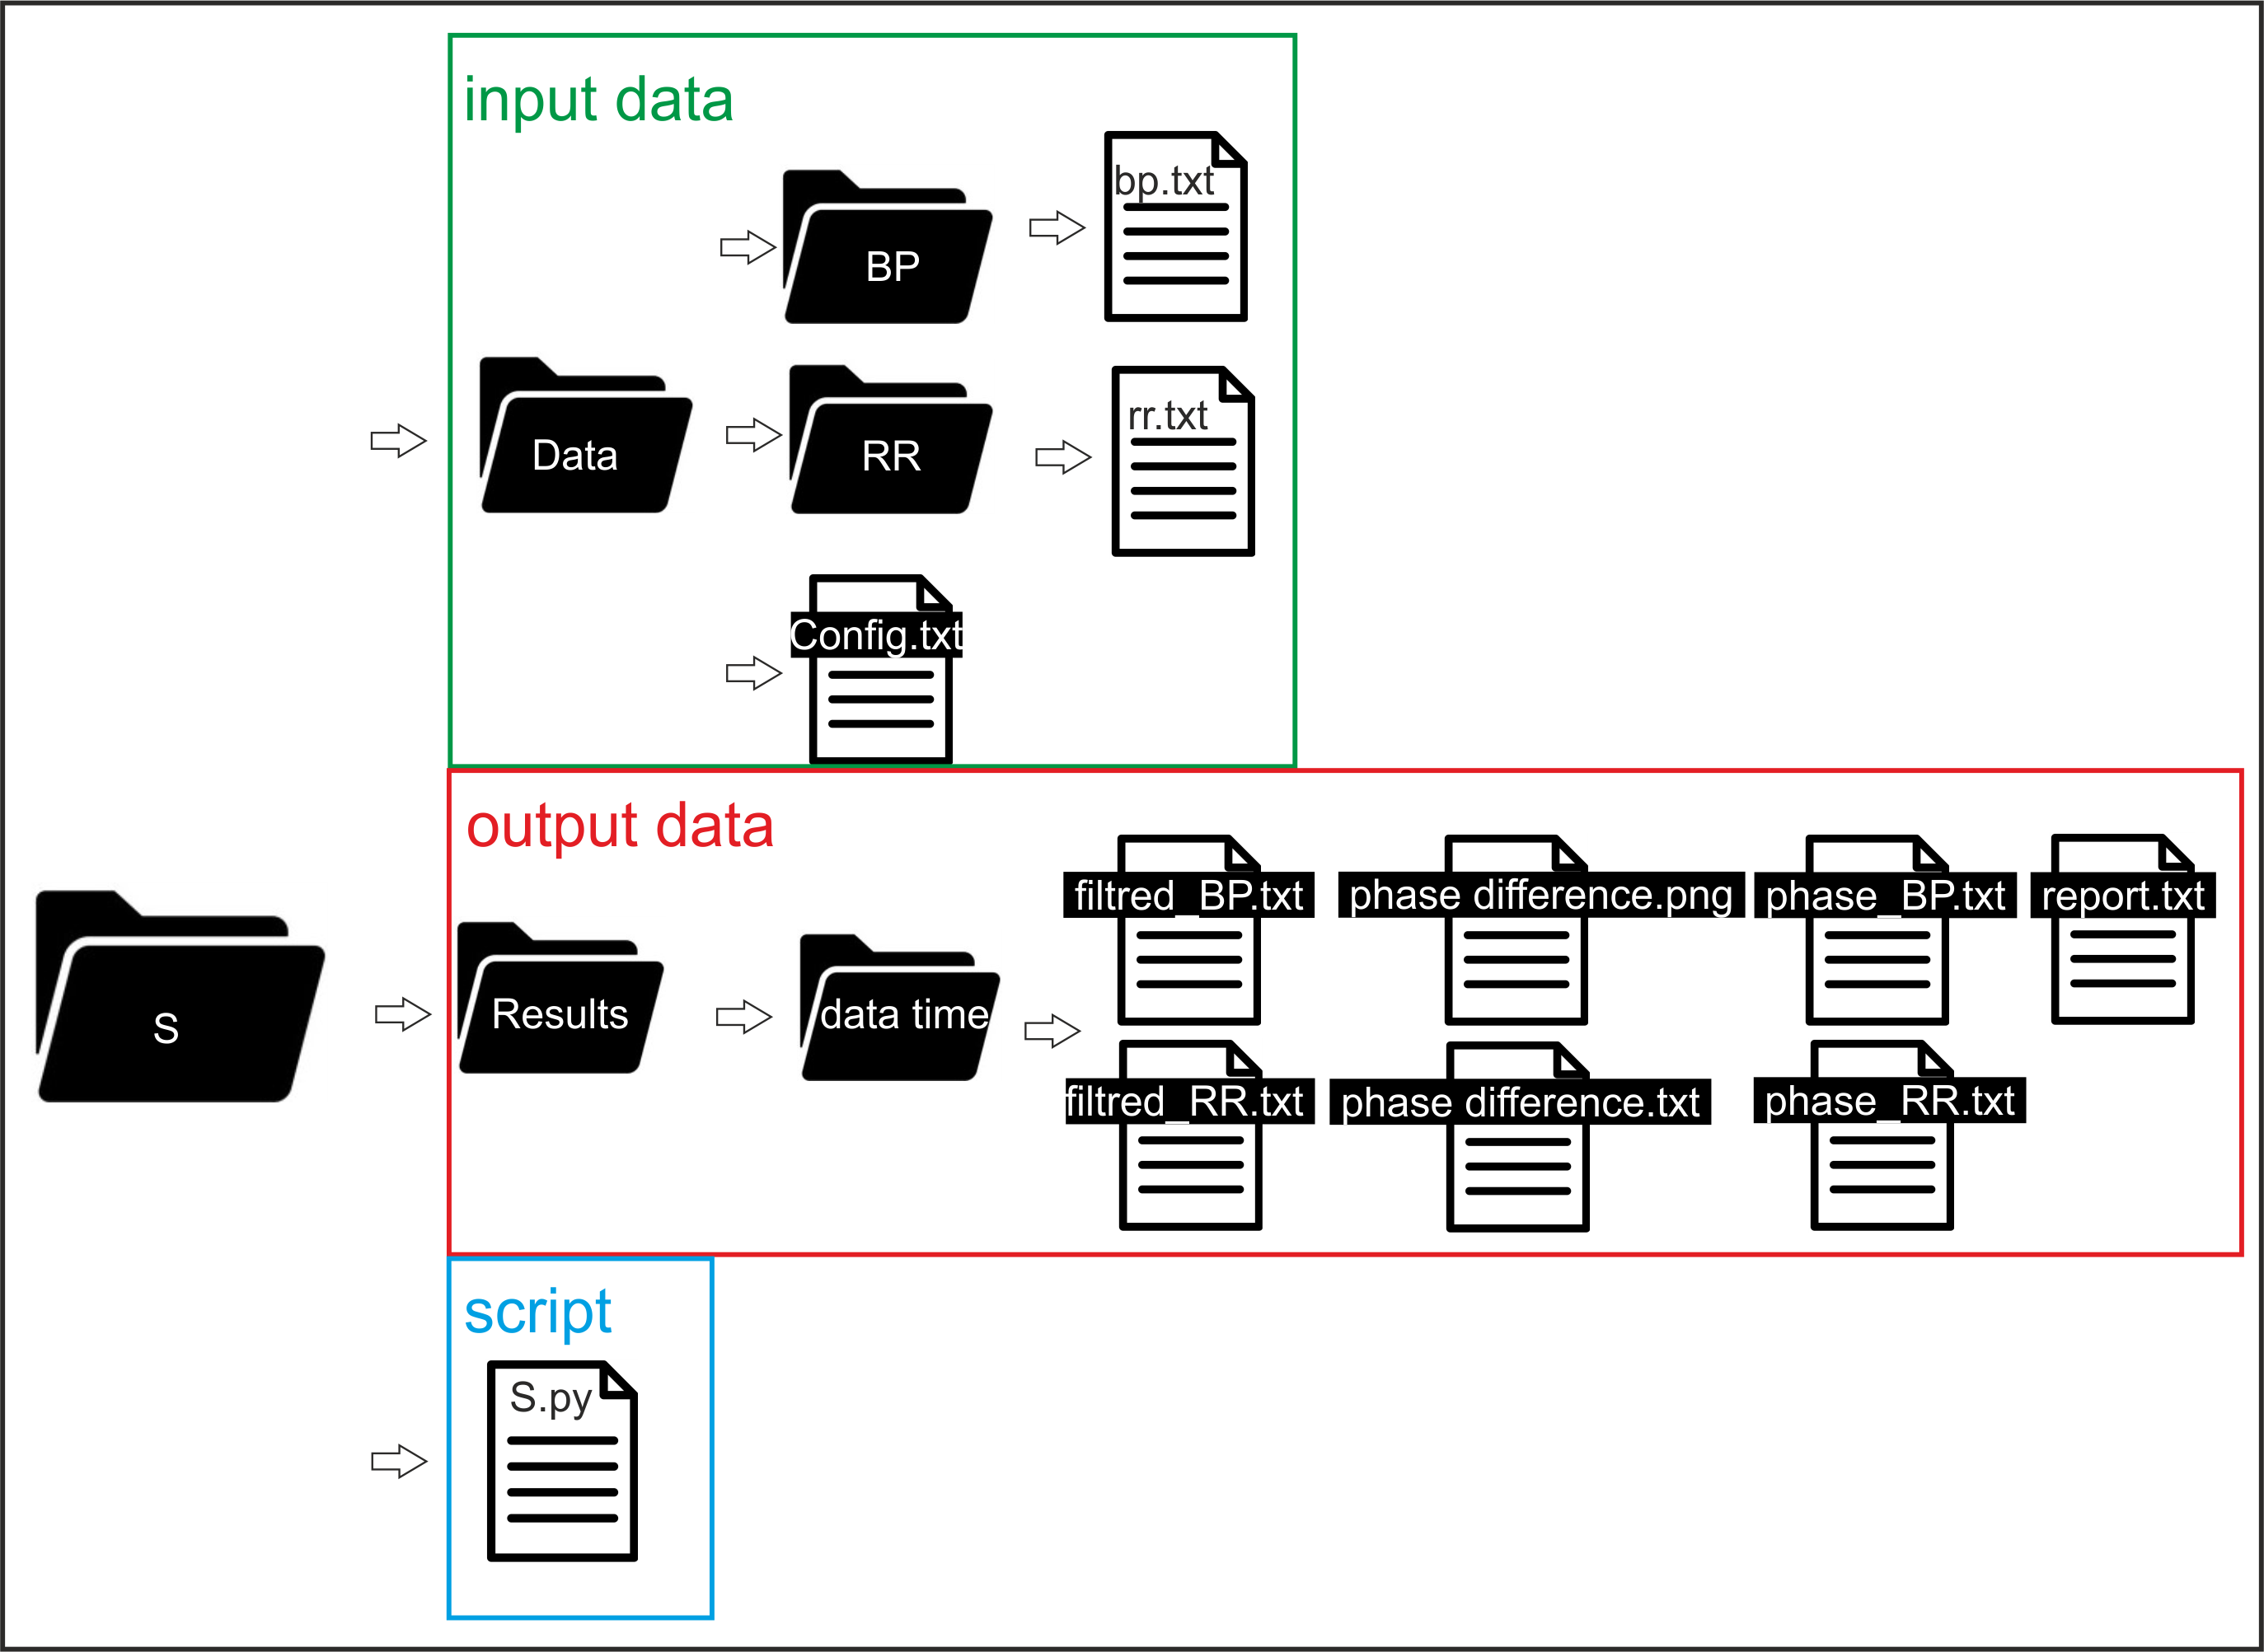
The proposed method was created in the form of a computer program (using Python). You can download the archive here

Figure 2 Data structure in the program archive.
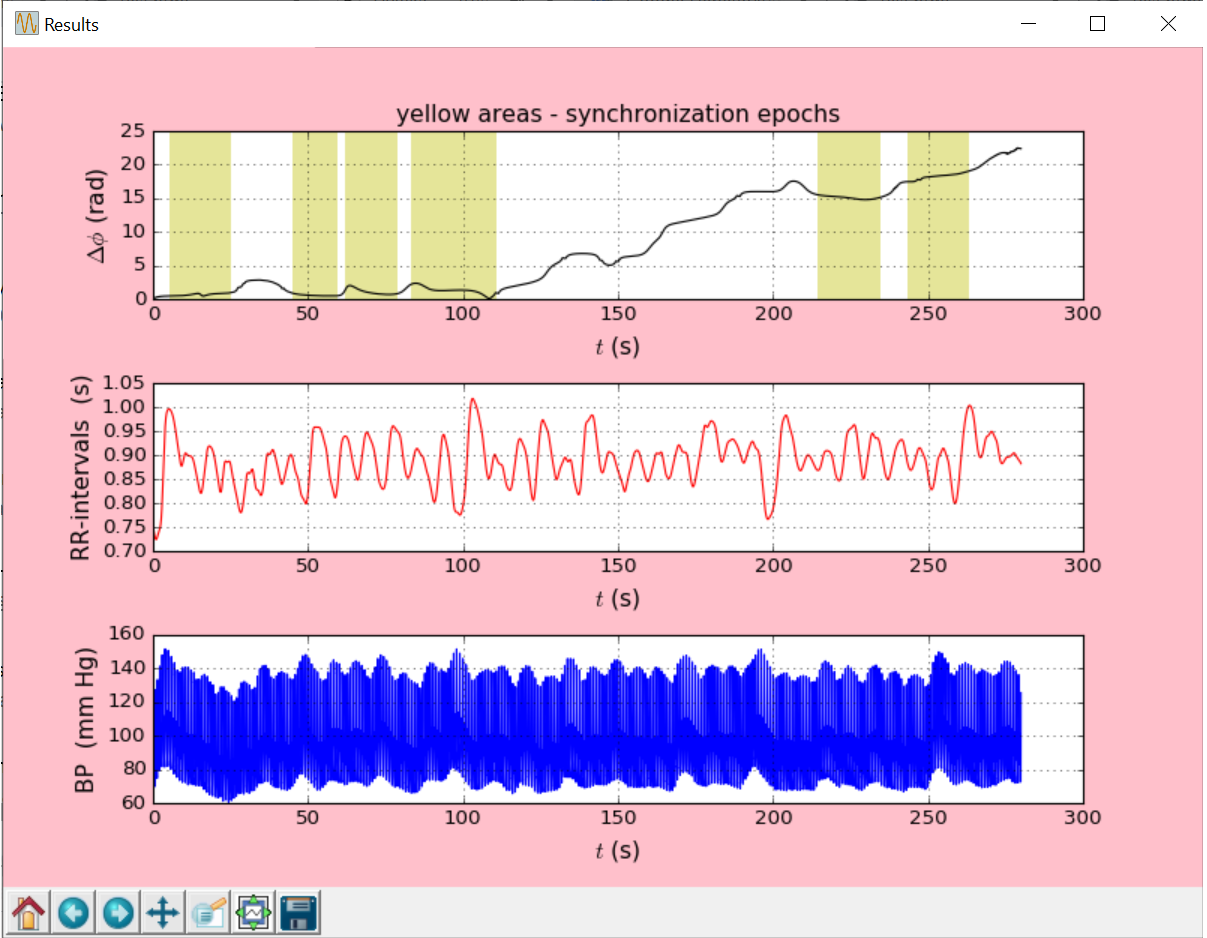
At the end of the work, the program opens the "Results" graphical form, where the phase difference (Figure 3.1), equidistant signal of RR intervals (Figure 3.2), BP signal (Figure 3.3) are displayed. An example of a graphical form is shown in Figure 3.

Figure 3. An example of a graphical form: 3.1 figure - the phase difference of filtred RR intervals and BP signals (epochs of phase synchronization are marked in yellow), 3.2 figure - equidistant signal of RR intervals, 3.3 figure - BP signal.
The program creates a folder with the resulting files and a report in the directory with the "S.py" file in the "Results" folder.


